
What is Singular value decomposition (SVD)?
The hidden engine behind Netflix recommendation system

Netflix has approximately 300 million users and 15,000 movies.
That’s roughly 4.5 trillion possible user-movie combinations to search through.
Comparing every user to every movie in real time? Impossibly slow.
So instead of brute-forcing it, they use one technique from Linear algebra to learn compact representations of every user and every movie.
It’s called Singular value decomposition or short SVD and it is a powerful technique to factor any matrix into the product of 3 matrices, each with special properties. It reduces a matrix to its constituent parts in order to make certain subsequent matrix calculations simpler.
How does it work?
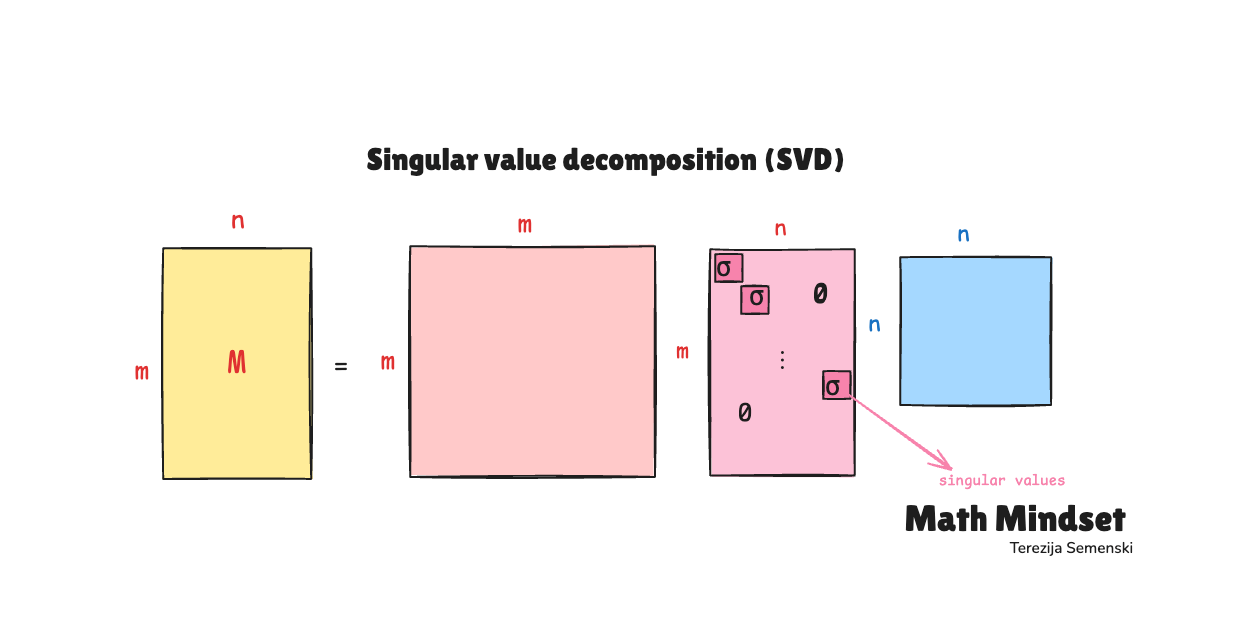
SVD decomposes that massive user-movie interaction matrix into 3 smaller matrices:
M = U × Σ × Vᵀ
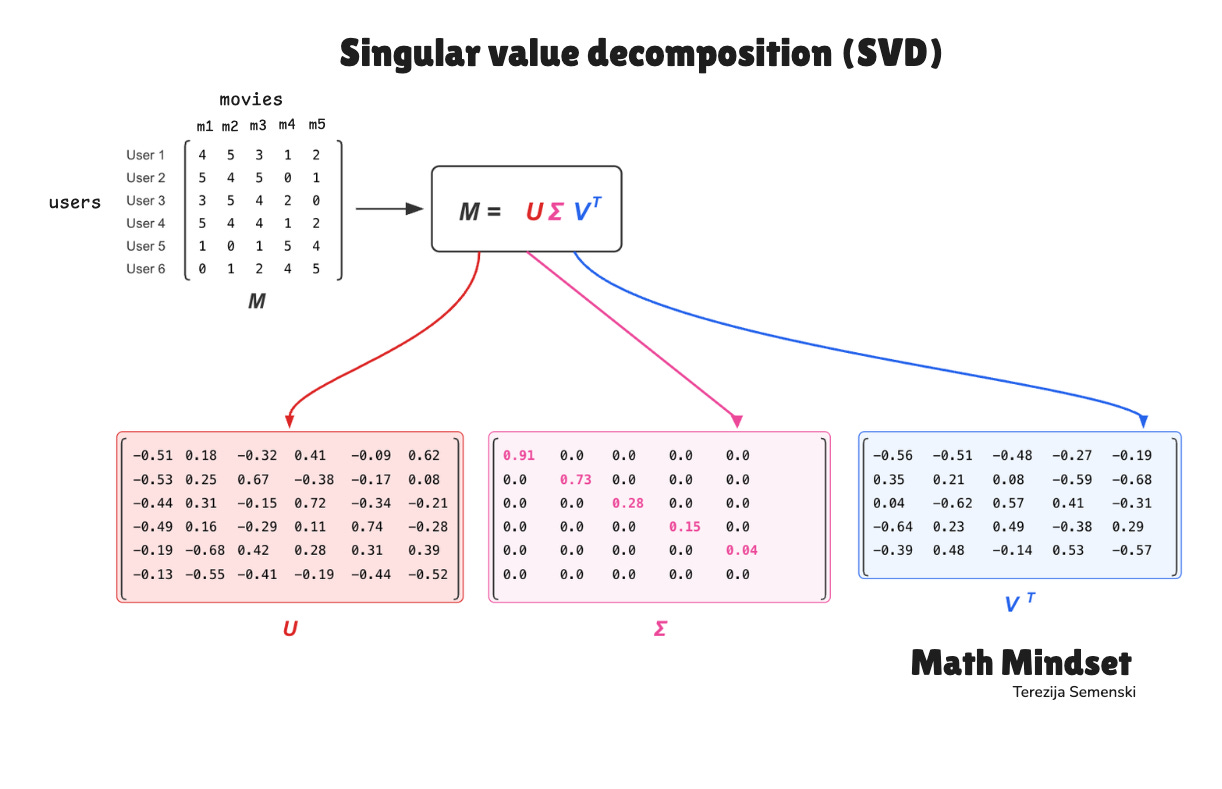
SVD factorizes the original ratings matrix M into 3 matrices that work together:
U (user matrix): each row represents one user as a vector in a 50-dimensional latent space. These 50 dimensions correspond to hidden patterns that SVD extracts from the data (like preference for action, tolerance for slow pacing, or affinity for specific directors).
These are not predefined, SVD derives them from the structure of the ratings.
Σ (singular value matrix) is a diagonal matrix containing 50 singular values, sorted from largest to smallest. Each value indicates how much its corresponding dimension contributes to the overall ratings. The first singular value captures the strongest pattern; the last captures the weakest.
This is why truncation works: dropping the smallest values removes the dimensions that contribute the least.
Vᵀ (movie matrix): each column of V (i.e., each row of Vᵀ) represents one movie as a vector in the same 50-dimensional latent space as the users. Because users and movies share the same space, their positions become directly comparable.
To predict user i’s rating for movie j, you compute:
Where U_i is the i-th row of U, Σ is the diagonal singular value matrix, and V_j is the j-th column of V (equivalently, the j-th row of Vᵀ transposed back).
Why does this work?
Because your preferences are predictable.
If you watched Titanic and loved it, the recommendation system built on SVD will likely suggest The Notebook because it discovered the pattern from millions of users who behaved like you.
Around 50 hidden dimensions (as an illustrative example) can be enough to capture the major taste patterns across an entire catalog like Netflix’s.
Here’s the part that will surprise you:
SVD is also used for image compression. A 1,000×1,000 photo has 1 million pixels. Keep only the top 50 singular values, and you store roughly 100,050 numbers (the truncated U (1,000×50), 50 singular values, and the truncated Vᵀ (50×1,000). That’s a 10× reduction in storage.
Why is SVD important in ML?
Datasets, model weights, activations, gradients, and embeddings are typically represented as matrices or higher-dimensional tensors. The problem is that real-world data is enormous and messy — millions of rows, thousands of columns, and often a great deal of redundancy, sparsity, and noise.
SVD cuts through that complexity by separating the dominant structure in the data from less informative variation. It tells you, which directions capture the strongest patterns and which contribute relatively little.
The most important application: NPL and semantic search
Of all SVD’s applications, one of the most influential is Latent Semantic Analysis (LSA) which is an early technique that helped machines move beyond simple keyword matching toward capturing semantic relationships between words.
Here’s the problem LSA solves.
Suppose you search for “car.” A keyword-based system returns all the documents containing the word “car”. It may miss documents that use words like “automobile,” “vehicle”, or “sedan”. The system doesn’t understand that these words are related. It only matches exact terms.
LSA approaches the problem differently. It begins by constructing a word-document matrix: rows represent words, columns represent documents, and each cell records how often a word appears in a document. SVD is then applied to that matrix.
After dimensionality reduction, words and documents that occur in similar contexts become closer together in a latent semantic space. “Car” and “automobile” end up near each other not because someone explicitly told the system they are synonyms, but because they tend to appear alongside similar words such as “engine”, “driver” and “road” across many documents.
The geometry of the matrix begins to encode meaning.
This idea became one of the foundational concepts in modern NLP. Word2Vec, GloVe, and the embedding layers used in modern transformers build on the same core insight: semantic meaning can be represented geometrically in a learned vector space, and mathematical structure can reveal relationships that were never explicitly labelled.
Where SVD shows up across ML
Dimensionality reduction
Most datasets contain far more features than meaningful underlying patterns. When applied to centred data, SVD provides the principal directions that capture the most variance, allowing less informative dimensions to be discarded. In many datasets, a relatively small number of latent dimensions can capture most of the meaningful structure.
The result is less computation, reduced overfitting, and faster training.
Noise filtering
When you truncate the smallest singular values, you’re not just saving storage — you’re often removing components that contribute little to the overall structure of the data and are more likely to represent noise or measurement error.
As a result, models trained on the compressed representation can sometimes generalise better than models trained on the raw data because they focus on the strongest patterns rather than fitting every small fluctuation.
Latent structure discovery
SVD doesn’t just compress data, but it can reveal structure hidden within it. The leading singular vectors often align with meaningful latent patterns: topics in documents, user preferences in recommendation systems, or visual features in images.
These patterns were not manually labelled or engineered. They emerge directly from the statistical structure of the data itself. That’s what makes SVD a tool for understanding as well as computation.
P.S. Thank you for reading this far.
That alone puts you in rare company: most people scroll past anything that asks them to think slowly.
The fact that you’re here suggests you already value the kind of thinking this newsletter is about. Share it with someone who values it too. Those people are worth finding.
Comment below and share the newsletter/ issue if you think it is relevant!
Feel free to also follow me on LinkedIn (very active), Instagram(not so active) or X (not so active).
Until next week’s issue, keep learning, keep building, and keep thinking like a mathematician.
-Terezija
Love it bring it on. Do a short one on matrix multiplication
Oh man... Much enjoyed! Was watching a series on NF which had a McMuffin about data compression... serendipity knocking! Thank you!