
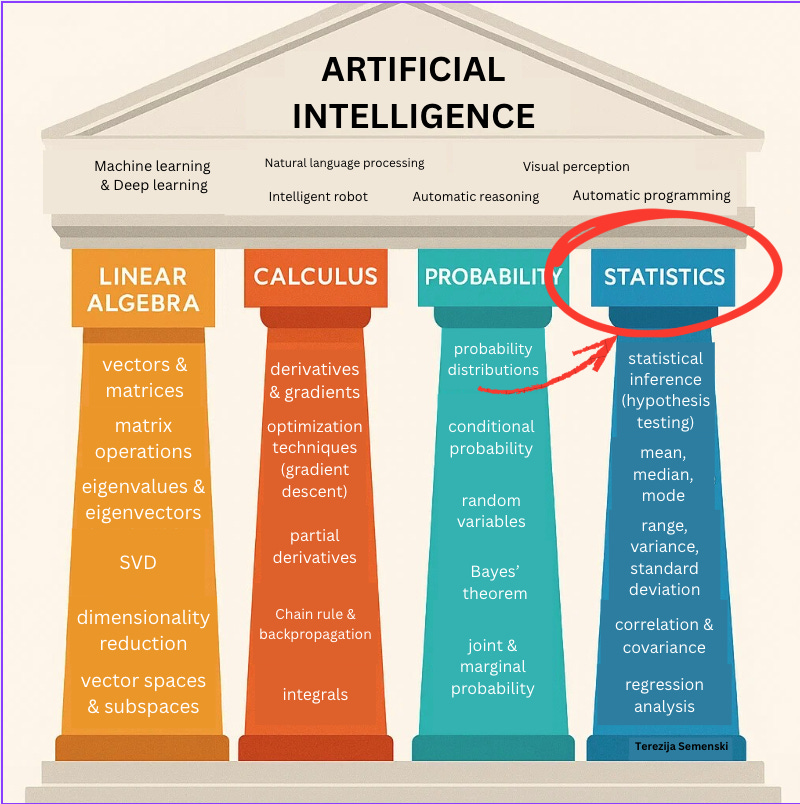
Issue #11: Why every ML engineer should think like a Statistician (part II.)
Understanding statistics isn't desirable, it's crucial
In our last issue, we focused on measures of central tendency and their importance in ML.
This time, we shift our attention to measures of variability.
We’ll explore range, variance, standard deviation, and the standard error of the mean, and why mastering them is essential for building robust models.
What are the measures of variability?
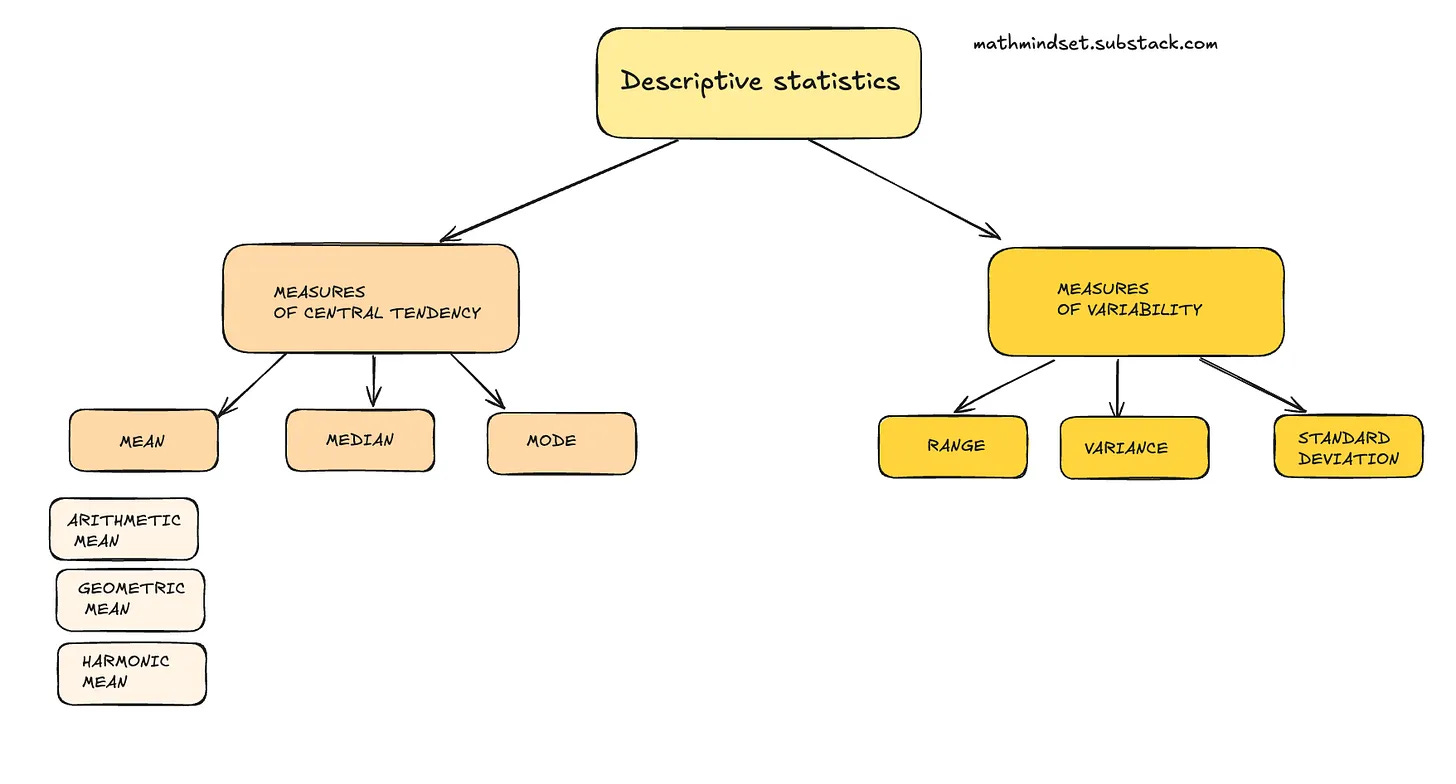
When working with data, knowing how spread out the values are is just as important as knowing averages. Measures of variability, such as range, variance, and standard deviation, tell us how much our data points differ from one another.
For machine learning beginners, these concepts might seem statistical, but they play a crucial role in building better models and detecting data issues.
For example, measuring data dispersion can help identify outliers in a dataset.
In this newsletter issue, we’ll explain each measure in clear terms, explore the intuition behind them, and discuss when and why they are useful in ML.
Understanding measures of variability
What is a range?
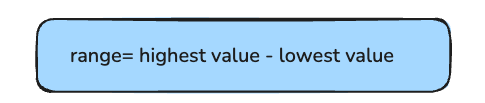
Range is the simplest measure of variability. It’s the difference between the maximum and minimum values in a dataset.
It is calculated by subtracting the lowest value from the highest value of the dataset.
For example, if your model’s training data consists of numerical data, such as individuals’ age and annual income.
Individuals’ ages go from 18 to 90, so the range of the age feature is equal to 90-18=72 years.
The annual income goes from $48,000 to $857,000, so the range is $809,000.
The range gives a quick overview of the data’s spread.
Think of range as the span of your data. A wide range means values stretch far apart (high variability), while a narrow range means they’re clustered closer together (low variability).
Range is straightforward to compute and understand. However, the range only reflects the two extreme values and ignores the rest of the distribution. This means it can be misleading if those extremes are outliers. One unusually large or small value can dramatically increase the range without the rest of the data being very spread out.
But where is range used in ML?
In ML, range often comes up in data preprocessing.
One common use is min-max normalization, where we rescale features to a 0-1 range using the minimum and maximum. This ensures different features are on comparable scales.
Range can also be a quick check for anomalies: if one data point is way outside the typical range, it could be an outlier or data error.
For instance, if 99% of houses in a dataset have prices between $200k and $500k, but one house is listed at $5 million, the price range would be very large, almost $5 million, flagging a potential anomaly to investigate.
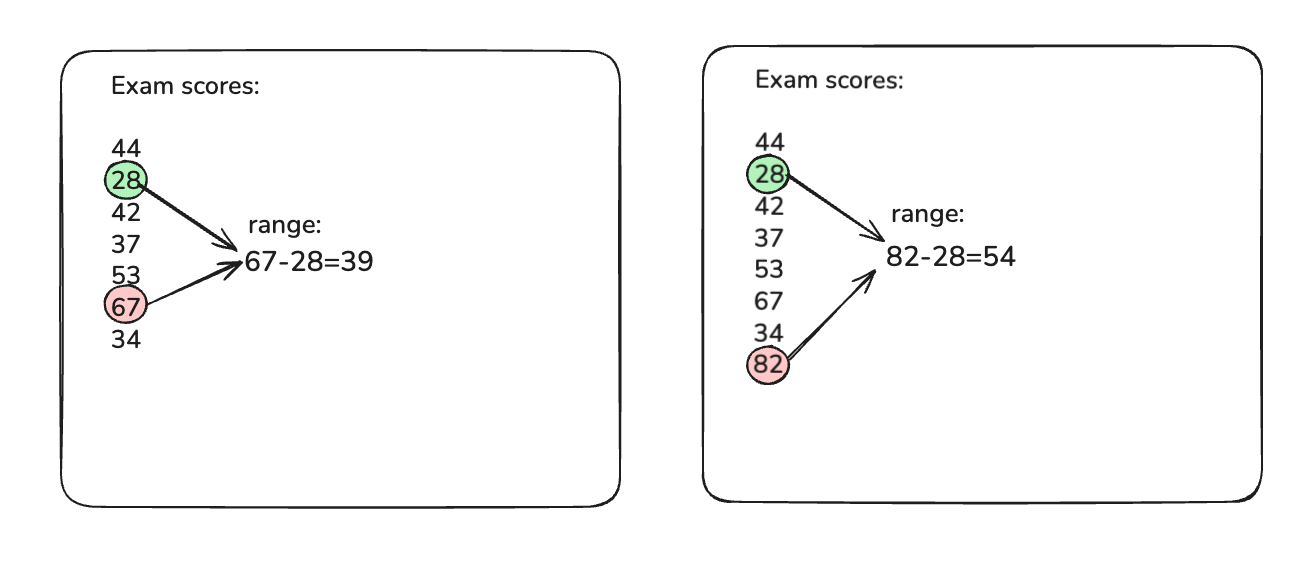
Let’s explore a simple example of a range for exam scores. The lowest score is 28 and the highest is 67, so the range is 39 points.
After adding an outlier (a very high score of 82), the range jumps to 54 points. This dramatic increase shows how sensitive the range is to outliers, so a single extreme value expanded the spread significantly. In practice, if you see such a jump in range, you’d likely examine that outlier more closely (it could be a data entry mistake or a genuinely exceptional case).
What is a variance?
Variance measures the average of the squared differences from the mean. To calculate the variance, you have to find the difference between each point within the data set and the mean. Once you figure that out, square and average the results.
In simpler terms, for each data point, find how far it is from the mean, square that distance (to make it positive), and then take the average of all those squared distances.
This gives a numerical value for how spread out the data is around the mean. If all points are identical (no spread), the variance is 0.
The more the values deviate from the mean, the larger the variance.
Let’s explore variance on a simple example.
Imagine you’re interested in finding out which large language models (LLMs), such as ChatGPT, Claude, or Gemini, are most popular among developers.
You could attempt to ask every software developer in the world which LLM they prefer. That entire group, meaning all developers, is called the population.
But surveying the entire population is often expensive, slow, or impossible (usually all three mentioned).
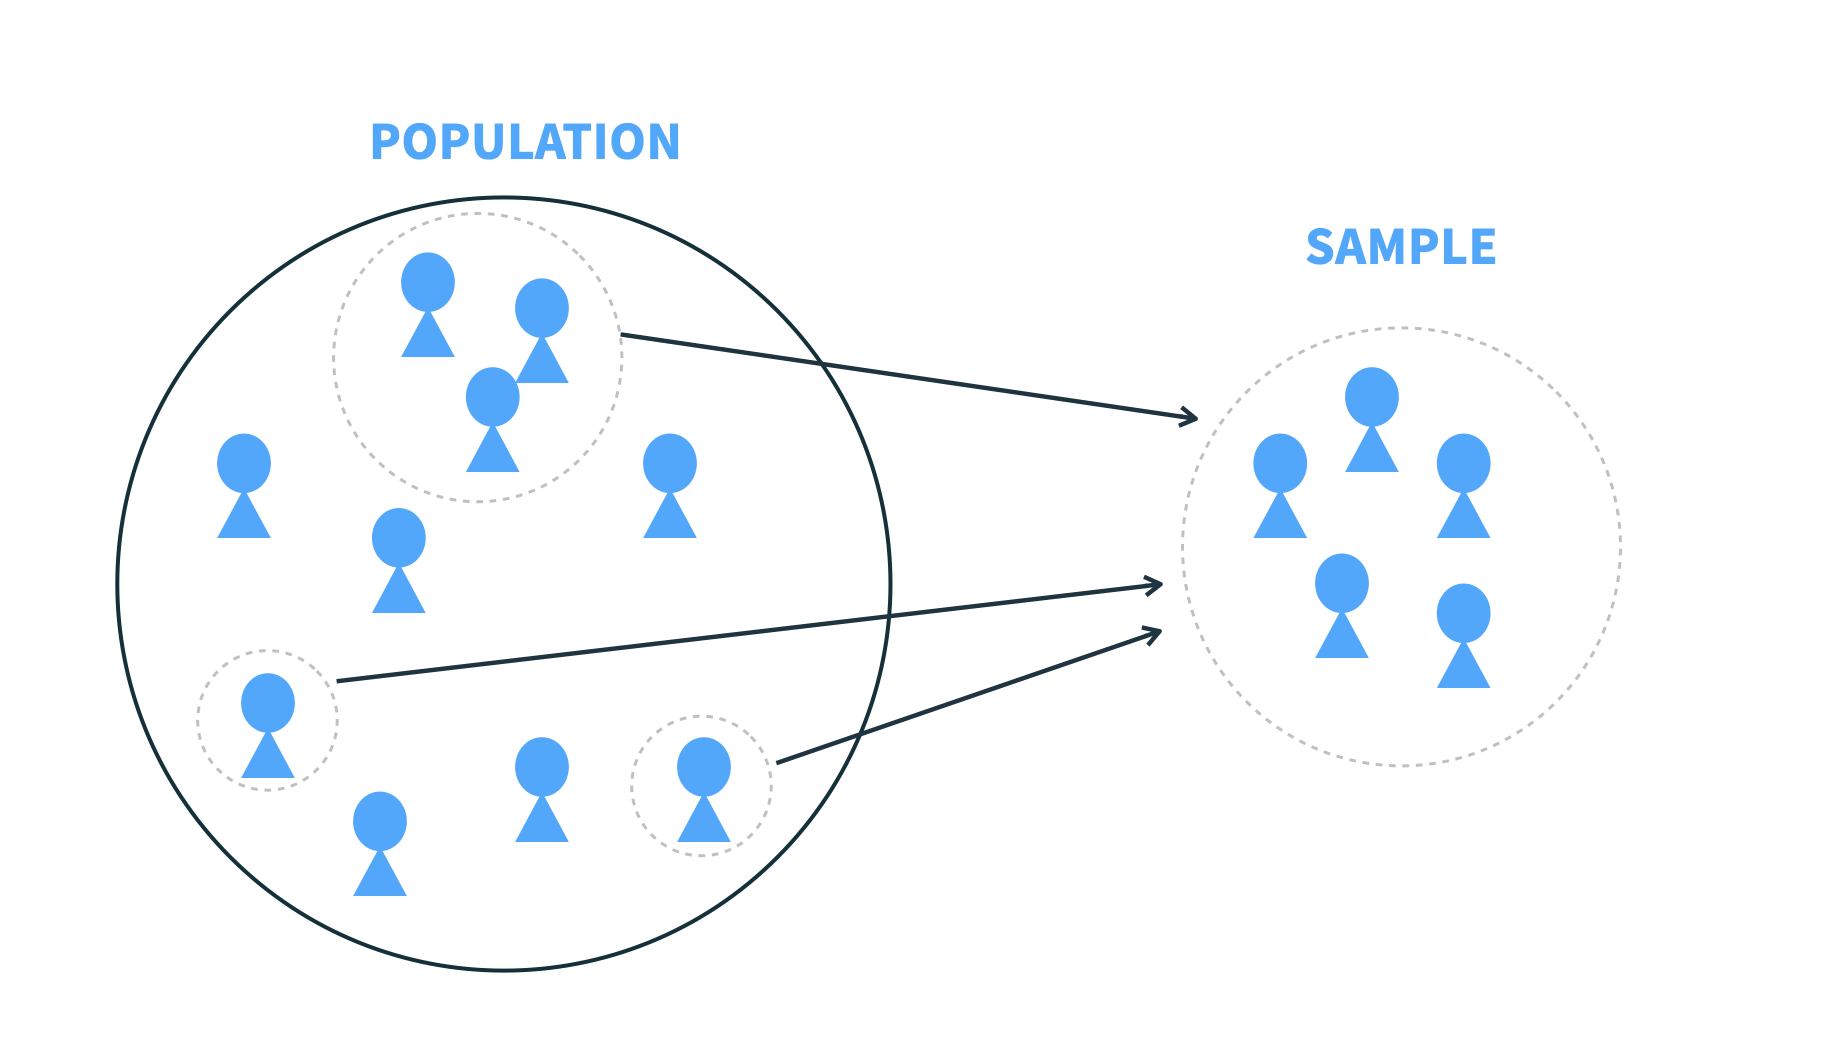
A more practical approach is to collect data from a sample, a smaller group that represents the larger population. For example, you might survey 10,000 developers at a major AI conference to learn which LLMs they use most. This group becomes your sample.
Population vs. sample: what’s the difference?
Population = the entire group you’re studying
Sample = a subset of that group, used to draw conclusions about the whole.
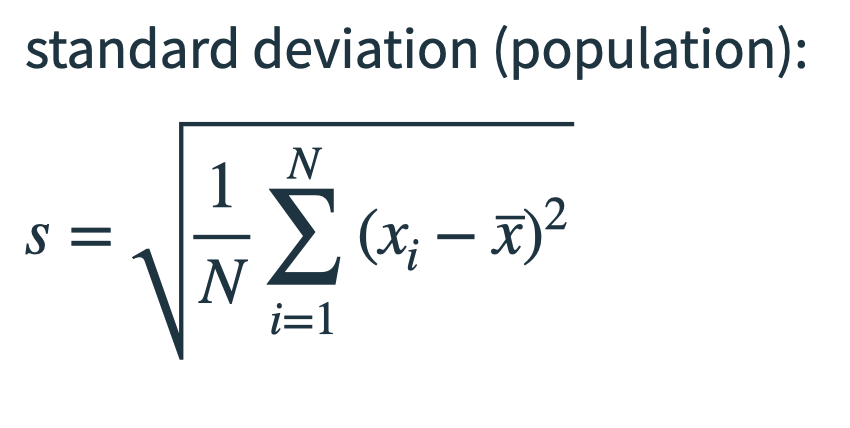
But when we compute measures like variance and standard deviation, it’s important to know whether we’re using a sample or the population, because the formulas differ slightly.
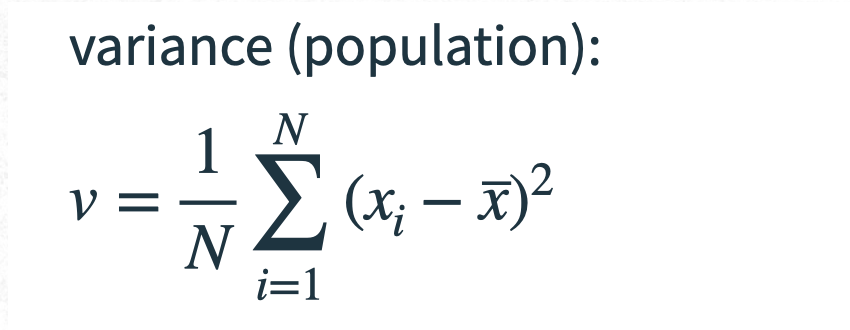
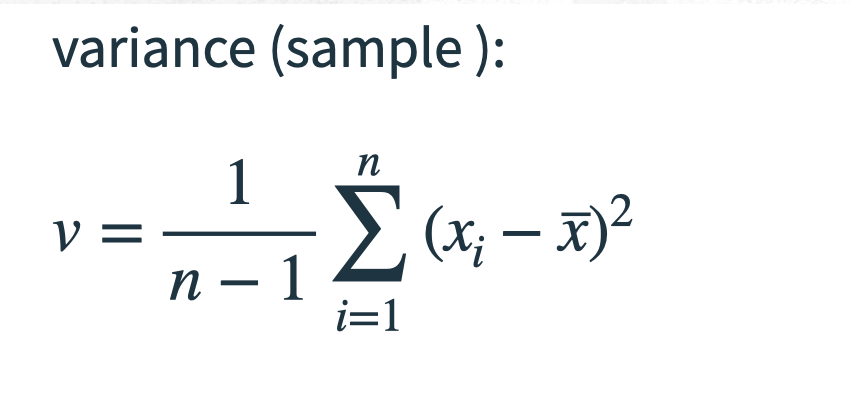
For the variance, we use these two formulas:
Why do the formulas differ?
When you calculate variance or standard deviation from the population, you divide by N (the total number of items).
When you calculate them from a sample, you divide by (n − 1) instead of n. This is called Bessel’s correction, and it compensates for the natural underestimation bias in sample variance.
Variance uses all the data points in its calculation, not just the extremes. This makes it a more precise measure of variability than the range.
A small variance means most values are tightly clustered near the mean, while a large variance indicates values are widely scattered.
Because we square the deviations, variance emphasizes larger differences: points far from the mean contribute disproportionately more to the variance than points near the mean.
This also means variance (like range) is sensitive to outliers, meaning an extreme value far from the mean can push the variance up a lot.
Another thing to note is that variance is measured in squared units, which isn’t always intuitive.
Let’s see it in action on a simple example.
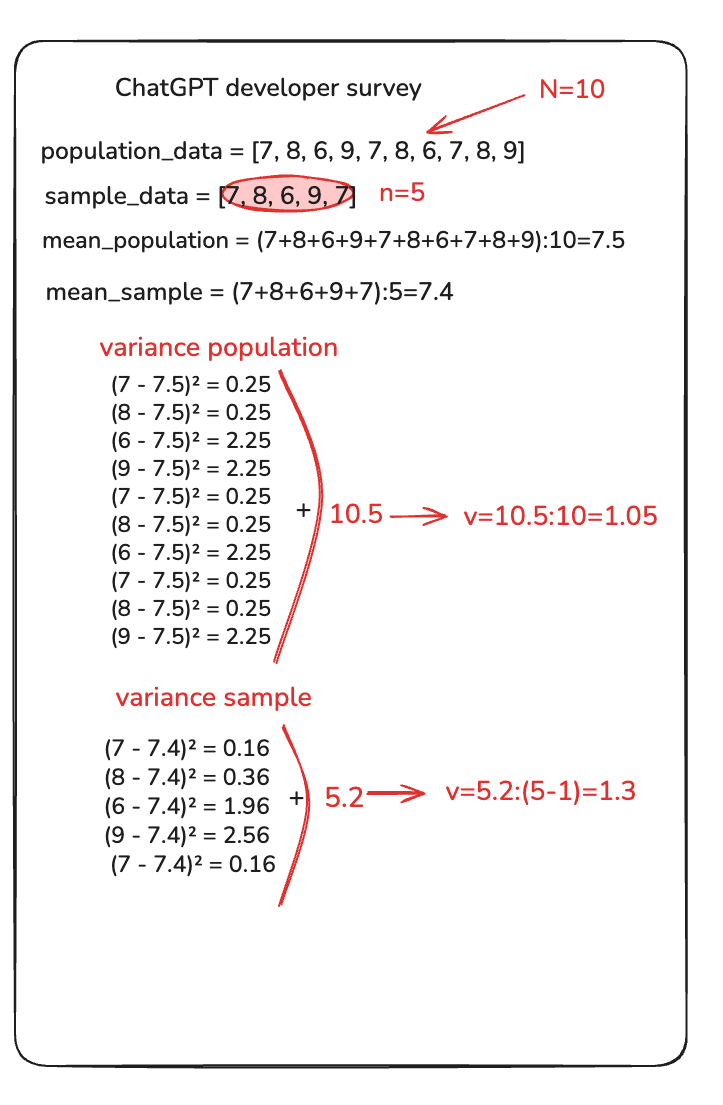
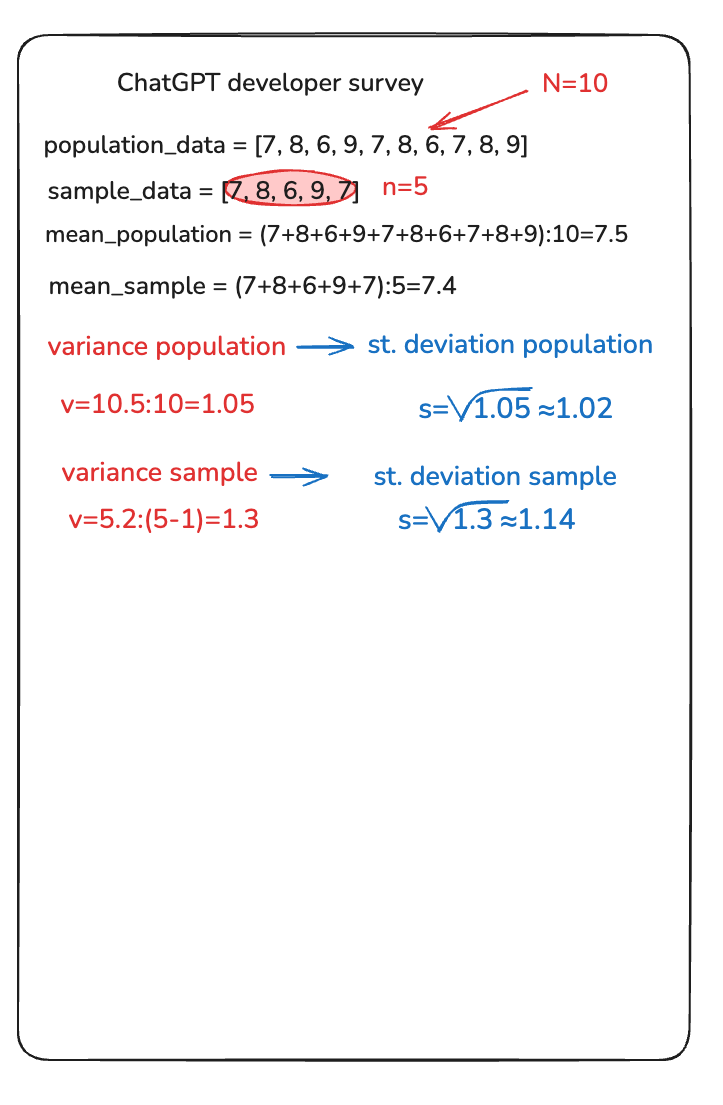
Suppose you ask 10 developers to rate ChatGPT on a scale from 1 to 10. Your population is 10 developers, and you randomly select 5 of those responses as a sample.
Now let’s calculate the mean for the population and the sample, and then population variance and sample variance:
Now, you probably still wonder where variance is used in ML?
Feature selection (Low-variance filter): Features that hardly vary across samples (variance ~ 0) carry little information and can be safely removed to simplify the model. Removing features with extremely low variance can reduce noise and computational cost without hurting model performance.
Regularization and overfitting: Variance also appears in the context of model performance; you might have heard of the bias-variance tradeoff. A complex model might fit the training data too closely and have high model variance (its performance varies greatly with new data). Techniques like regularization are used to control this by penalizing extreme parameter values, effectively aiming to reduce the model’s variance. While this is about model behavior rather than the raw data’s variance, it reflects the general idea: large variability can be a sign of instability. By understanding variance, you’ll be alert to models that might be overfitting (high variance in predictions) versus those that underfit (low variance but perhaps high bias).
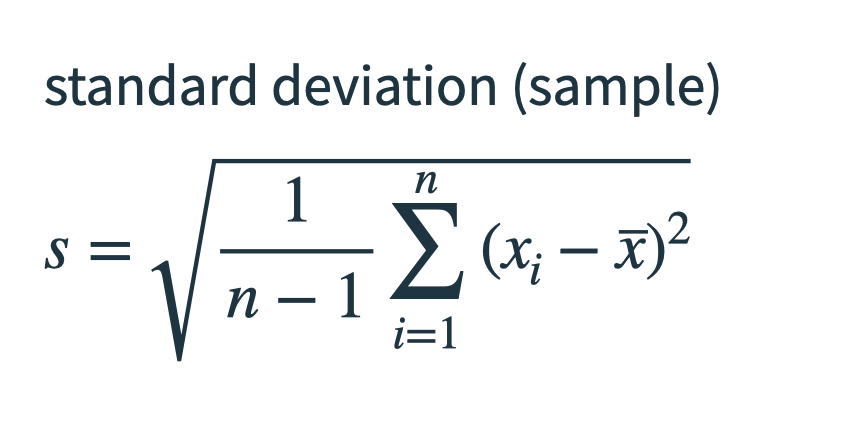
What is a standard deviation?
Standard deviation (often noted with the Greek letter σ or just lowercase s ) is simply the square root of the variance.
We also have two slightly different formulas (depending on whether we take a population or a sample)
Standard deviation is arguably the most widely used measure of dispersion because it’s easier to interpret. If the standard deviation of exam scores is 5, you know that, roughly, a lot of people scored about 5 points away from the average score.
Let’s take a look at our example:
A low standard deviation means values are clustered closely around the mean, while a high standard deviation means values are spread out over a wider range. One reason standard deviation is popular is that it ties in neatly with the normal or Gaussian distribution (the classic “bell curve”).
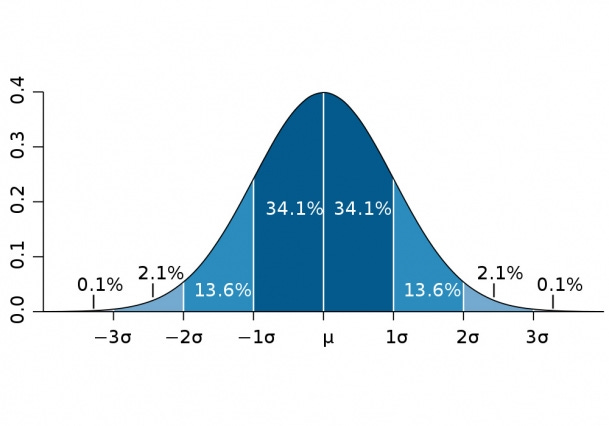
Image credit: openbooks library
In a normal distribution, we have a neat rule: about 68% of values lie within 1 standard deviation of the mean, ~95% within 2, and ~99.7% within 3 standard deviations from the mean. This is often called the “68-95-99.7 rule.” It means if you know the standard deviation, you have a pretty good sense of what’s a “typical” vs. an “extreme” value in your data. For example, if a data point is 3 standard deviations above the mean, it’s a real outlier.
Where is standard deviation used in ML?
It is extremely useful in ML, especially in data preprocessing and evaluation:
Feature Scaling (z-score normalization): Many ML algorithms perform best when features are on similar scales. Z-score normalization (also called standardization) uses the mean and standard deviation of a feature to rescale it. This transforms the feature to have a mean of 0 and a standard deviation of 1. The intuition is that we measure each value in units of “how many σ away from the mean” it is. Standardizing ensures that features with originally large ranges (say, annual income in dollars) don’t dominate features with smaller ranges (say, years of education) in algorithms that are sensitive to scale. In fact, if we didn’t normalize, an algorithm might give more weight to a feature simply because its values are larger in magnitude. By scaling by the standard deviation, all features are put on equal footing. For example, if one feature ranges from 1 to 1000 and another from 0 to 1, without scaling, the first feature could overshadow the second in a distance-based model (l. ike k-NN) just due to scale
Anomaly detection (Z-scores): Standard deviation is also used to define what counts as an outlier. ML practitioners use this in data cleaning.
There is one more measure we need to mention, which is connected with the variance and the standard deviation.
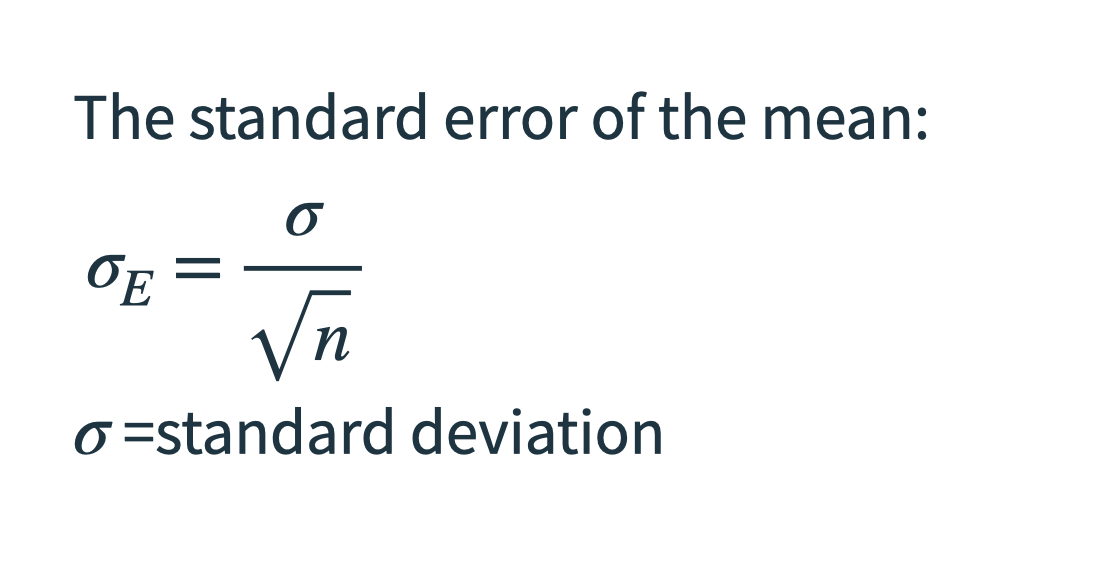
What is the standard error of the mean, or the standard error?Suppose we’re measuring the mean battery life of smartphones. We take one sample of phones and compute the mean battery life, then take another sample and do the same. These sample means will differ slightly, and the standard error tells us how much variation to expect between them. It’s calculated by dividing the standard deviation by the square root of the sample size, so increasing the number of observations in each sample reduces the standard error.

In ML, we often use standard deviation to describe the spread of values within a dataset, while standard error is used in the case we want to train and test different models, and then we would calculate the mean or the models for some metric, for example, the accuracy.
Why understanding variability matters in ML?
Mastering range, variance, and standard deviation can make you a better machine learning practitioner in several ways:
Better data preparation: Knowing these metrics helps in exploratory data analysis. For example, if you calculate the range or standard deviation of each feature, you might spot that one feature has an absurdly large spread, prompting you to check for outliers or errors. You might find that a certain sensor was faulty on one day (huge variance on that day’s readings), or that one category of users has a much wider range of incomes than another. These insights guide how you clean and prepare data. They also inform feature engineering decisions: a feature with zero variance (same value everywhere) can be dropped; a feature with extremely high variance might need to be log-transformed or normalized to be usable.
Improved model training and performance: Feature scaling using standard deviation (standardization) or range (min-max scaling) can significantly improve model training. Many algorithms (like gradient descent-based neural networks, SVMs, or k-NN) converge faster or perform better when features are on similar scales. By applying z-score normalization (using mean and σ), you ensure no feature with a larger numeric range inadvertently dominates the learning process. This leads to fair evaluation of feature importance; the model’s weights or distance calculations will reflect the true signal in the data rather than arbitrary unit scales.
Detecting issues and ensuring fair evaluation: Variability measures help in detecting data distribution issues that could affect model evaluation. Imagine you train a model on data with a certain variance, but your test set has a much larger variance. Your model might perform poorly because it wasn’t exposed to that level of variability. By comparing standard deviations or ranges between training and test sets, you can catch this problem early. It’s also important in cross-validation: if you notice your model’s performance metrics have a high variance across different folds, that indicates instability. Perhaps the model is overfitting, and you might respond by gathering more data or applying regularization.
Conclusion
Understanding range, variance, and standard deviation equips you with a toolkit to peek under the hood of your data. These measures of variability complement the measures of central tendency by answering:
How much do the data points differ? For an ML beginner, grasping these concepts will significantly improve your ability to preprocess data, diagnose problems, and interpret model results. Whether it’s spotting an anomaly through an extreme range, simplifying your feature set by removing low-variance features, or normalizing inputs so your model learns fairly, variability measures are your friends. They turn messy numbers into meaningful insights about spread and consistency.
By routinely checking and thinking about range, variance, and standard deviation, you’ll ensure that your models are built on solid data understanding, which leads to more reliable predictions and fair evaluations. In essence, these three simple statistics help you trust your data and tune your models for success.
Remember, ML is not just about algorithms, but also about getting the fundamentals right.
And measuring variability in your data is as fundamental (and important) as it gets.
Thanks for reading today’s issue.
If you’re here, you already think differently, like a statistician, not just an ML engineer.
You know that real progress starts with understanding your data, not just feeding it to a model.
Until next issue, keep learning, keep building, and keep thinking statistically.
-Terezija