
Issue #10: Why every ML engineer should think like a Statistician (part I.)
Understanding statistics isn't desirable, it's crucial
Many beginners in ML jump straight to model training.
They import TensorFlow, load a dataset, build a model, call fit()function, and hope for the best.
Or they import another most popular framework called Pytorch, create a model using nn.Module, and start training with a few lines of code.
But real understanding begins before the first epoch, with a simple summary of your data.
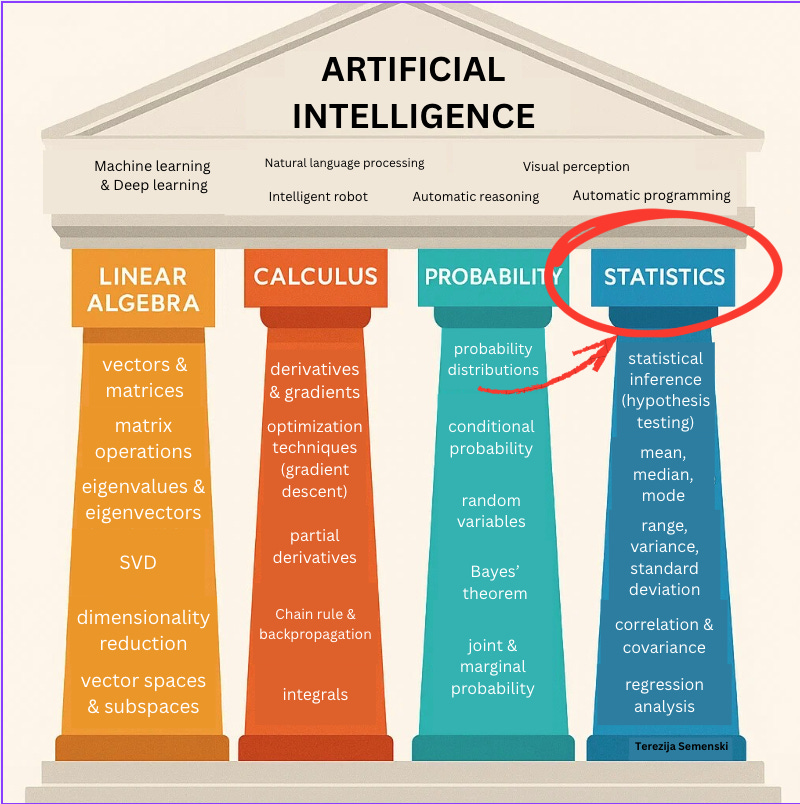
Why is statistics important for Machine learning?
Learning statistics forces you to slow down, but it provides the tools and techniques to collect, analyze, understand, and make inferences from data. It is applied in every step of ML: in preprocessing, cleaning, and exploring data, as well as building and evaluating models.
It starts with questions: What’s the average value? How much variability exists? Are there outliers distorting your view?
Those seem like trivial questions, but they determine everything downstream.
Scaling, normalization, and even your choice of loss function depend on understanding where the data centers.
If your features are normally distributed, the mean is the best descriptor.
If not, the median guards you against outliers.
If your data is categorical, the mode reveals which class has the highest probability.
Statistics isn’t a desirable thing to learn before transitioning to ML; it’s the foundation.
What is statistics?
Statistics is a branch of mathematics that deals with the study and manipulation of data, including ways to gather, review, analyze, and draw conclusions from data.
Every operation in ML, from loss functions to evaluation metrics, has a statistical backbone.
And measures of central tendency are the first tools that teach you to see your data as it truly is.
Having a powerful foundation in statistics will help you understand underlying relationships and build ML models that are optimized.
How do we divide statistics?
There are two major branches of statistics: descriptive and inferential statistics.
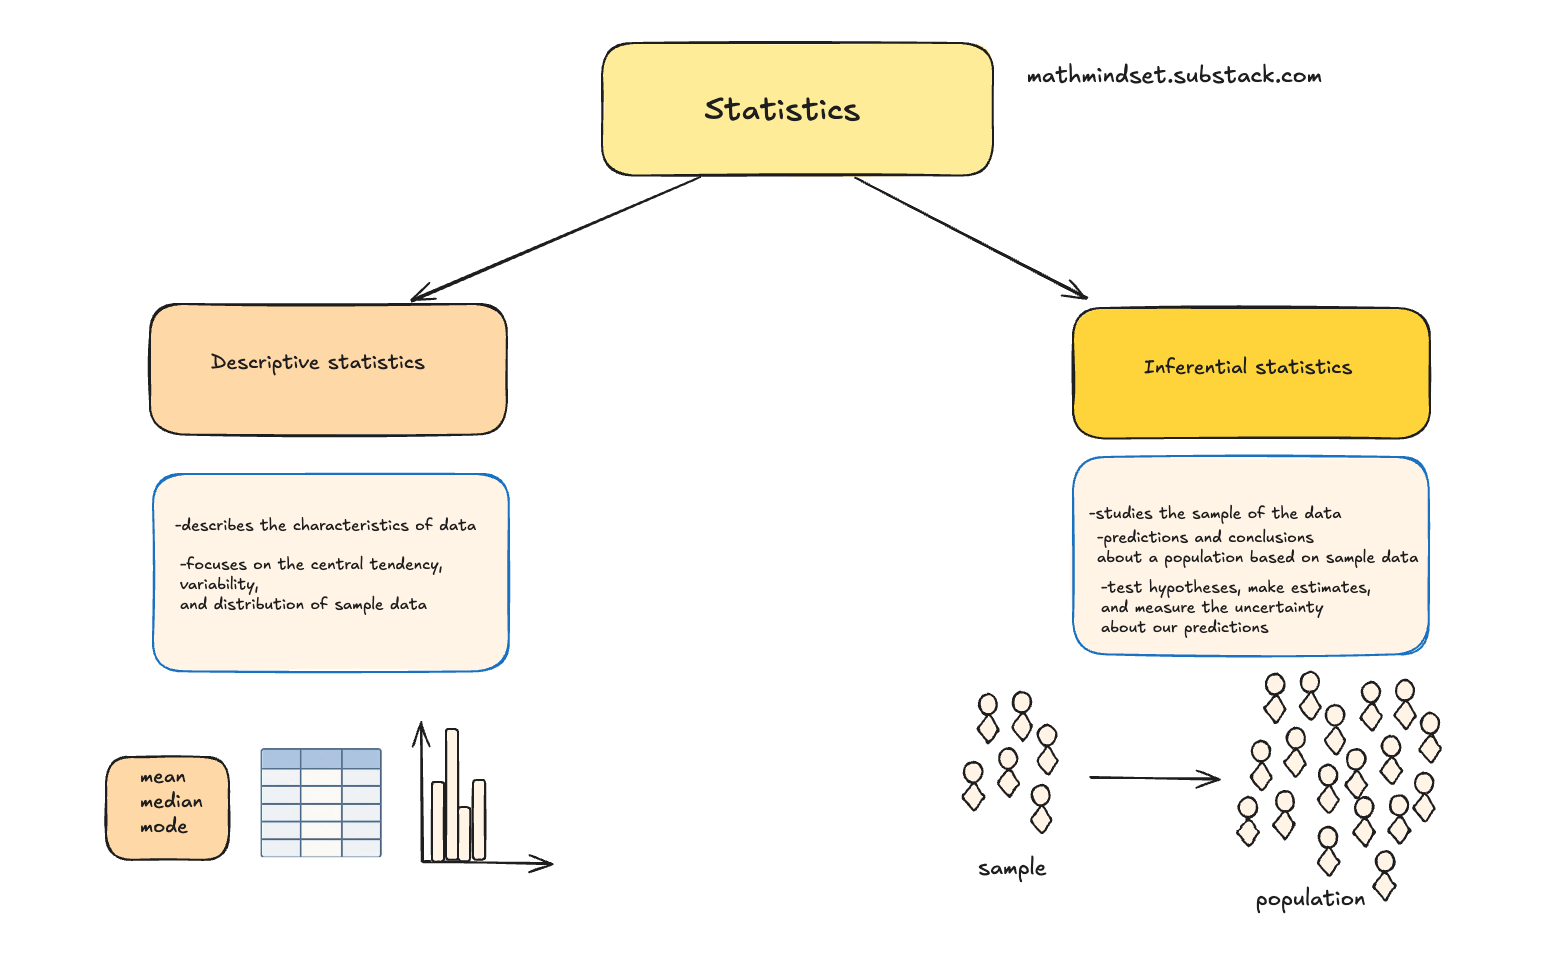
The most commonly used part of statistics is called descriptive statistics.
Descriptive statistics are used to describe or summarize the characteristics of a sample or data set, such as a variable’s mean, standard deviation, or frequency.
Inferential statistics allows us to make predictions and conclusions about a population based on sample data. Unlike descriptive statistics, which only summarize data, inferential statistics let us test hypotheses, make estimates, and measure the uncertainty about our predictions.
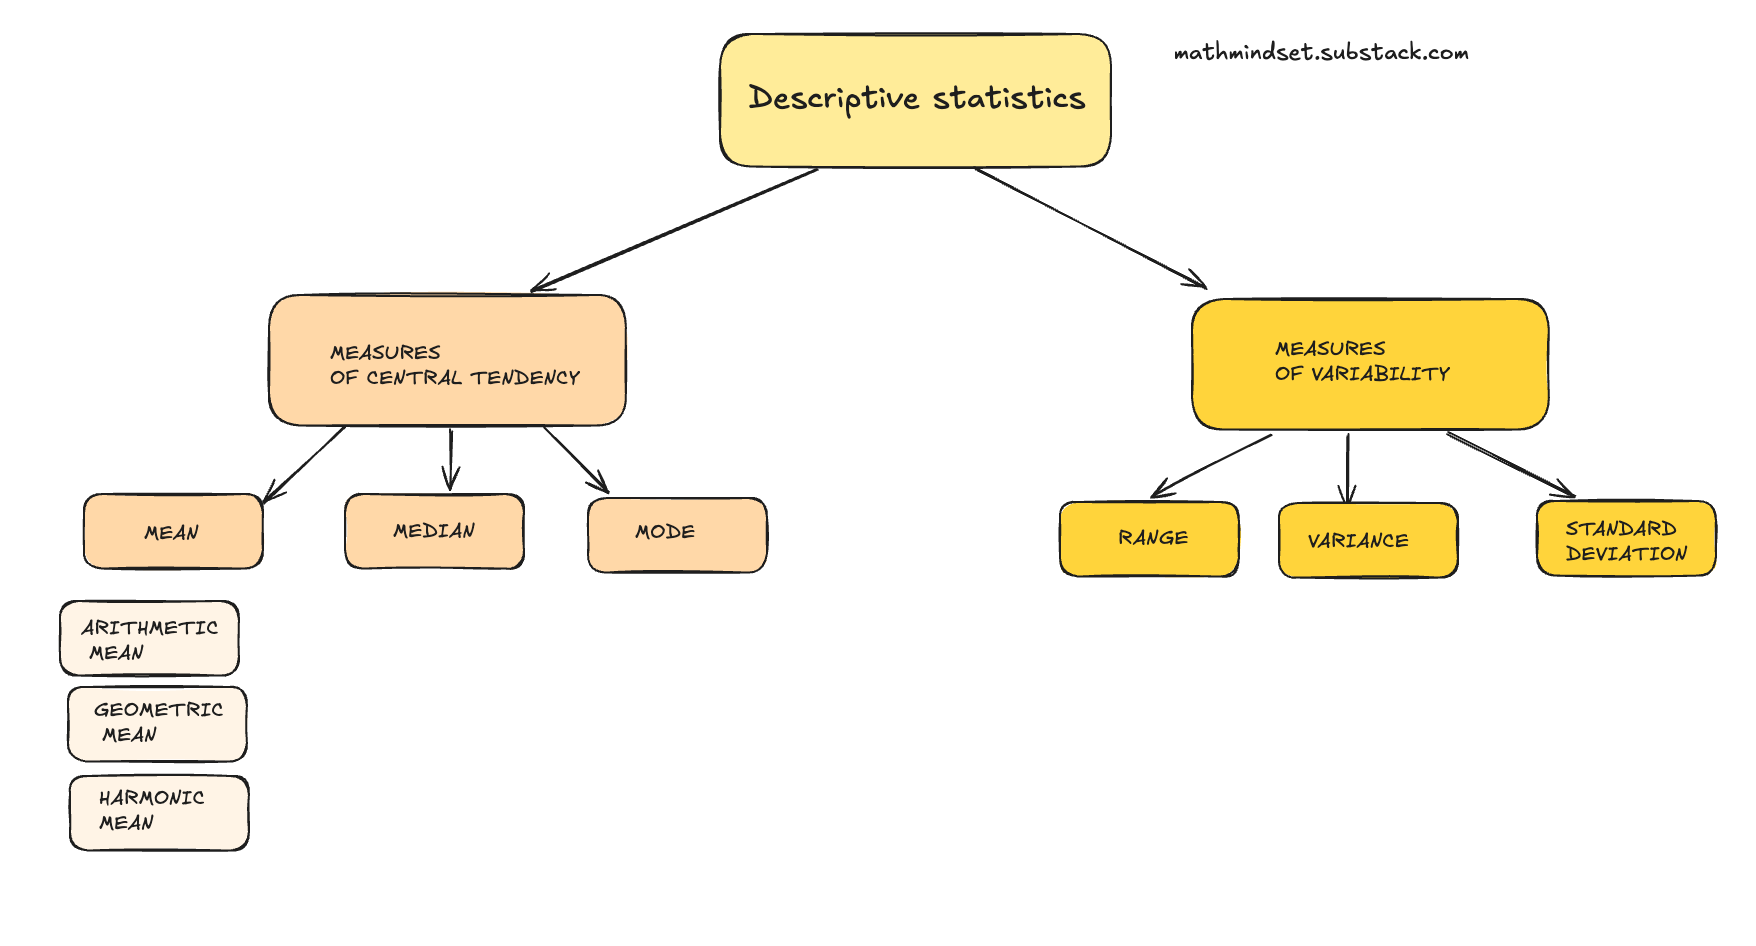
What are measures of central tendency?
Measures of central tendency are summary statistics that represent the center point or typical value of a dataset.
You can think of central tendency as the propensity for data points to cluster around a middle value.
The three most used measures of central tendency are: mean, median, and mode.
These show where most values in a distribution fall and are also known as the central location of a distribution.
What is a distribution?
A distribution describes how the values of a variable are spread or arranged across possible outcomes.
That way, we can see which values occur more frequently, which occur less frequently, and whether the data are clustered, symmetric, or skewed.
We represent distribution using frequency distribution and probability distribution.
In the case we want to summarize the actual data, we use a frequency distribution.
In the case we want to model possible outcomes mathematically, we use a probability distribution.
Now that we are familiar with the basics, let’s dive into a simple example to understand the measures of central tendency.
Understanding measures of central tendency
Imagine you just crushed your junior developer interviews
at an early-stage startup.
The CEO drops an interesting thing during the final round:
“Our average salary is $100,000 per year.”
You’re thrilled.
Until the offer arrives the next morning.
$70,000.
Wait, what? That’s way below the average.
Did they mess up the numbers?
Nope. Here’s how the math checks out.
How was the mean (that average) calculated?
1. The startup has 9 employees.
2. 2 senior devs make $140,000 each.
3. The CEO makes $200,000.
4. 6 junior devs (like you) are at $70,000.
Let’s do the math:
2 × $140,000 + $200,000 + 6 × $70,000 = $900,000
Divide that by 9 employees; sure enough, you get $100,000.
But here’s the thing: averages can be misleading.
When you see “average”, you’re looking at the mean.
However, in groups with significant outliers (hello, CEO salary), it skews the picture.
What is the mean?
There are 3 types of means: essential for understanding your dataset:
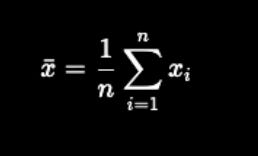
1. Arithmetic mean
↳ Add all the numbers and divide by the total number (how many they are). Simple, but powerful.
Used everywhere, from school grades to stock averages.
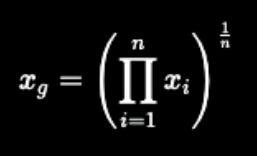
2. Geometric mean
↳Multiply all the numbers in a given dataset, then take the nth root.
Used for rates of growth, like in finance, or in biology (cell division, bacterial growth)
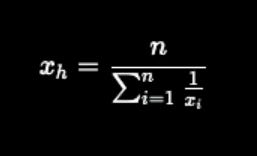
3. Harmonic mean
↳ Take the reciprocal of each number in a dataset. Add them up. Then divide the number of values in the dataset by that sum.
(It is the reciprocal of the arithmetic mean of reciprocals. Wow, I know this one sounds complicated.)
Used in finance and the technical analysis of securities markets.
Most people only remember the arithmetic mean from the math class, but the other 2 are also important,
especially when dealing with datasets that contain extreme outliers or skewed distributions.
For example, the geometric mean can be used in image processing as a filter to reduce image noise or in deep learning as a metric known as the Matthews correlation coefficient to evaluate the model.
The harmonic mean can often be used as an F1 score to evaluate classifiers.
What is the median?
The median is the middle value in the sorted dataset.
In the case the number of values is odd, it’s the center value,
In the case the number of values is even, it’s the average of the two middle values.
In our example, we have 9 values:
200,000, 140,000, 140,000, 70,000, 70,000, 70,000, 70,000, 70,000, 70,000 so the median is the 5th value: $70,000
What is the mode?
Mode is the value that occurs the most frequently in your dataset, making it a different type of measure of central tendency than the mean or median.
In our specific example, 70,000 occurs the most frequently, so the mode is the same as the median, meaning 70,000.
Thanks for reading today’s issue.
If you’re here, you already think differently, like a statistician, not just an ML engineer.
You know that real progress starts with understanding your data, not just feeding it to a model.
accurately.
Next week, we’ll go deeper and explore measures of variability, the math that explains how far your data strays from the center and why it matters for gradient stability and model generalization.
Until then, here’s a challenge for you:
Pick one dataset you’ve worked with recently. Visualize its distribution.
Compute its mean, median, and mode, and notice how each tells a slightly different story about your data.
Until then, keep learning, keep building, and keep thinking statistically.
-Terezija